A factory can be busy while the shops around it are quiet. Machinery orders, export demand and household spending do not move together automatically. Monday’s releases from China and Japan show why a healthy part of an economy should not be mistaken for a healthy whole.
China’s National Bureau of Statistics reported that industrial value added at enterprises above its designated size grew 4.8% in October from a year earlier, after adjusting for prices. Its separate retail release showed total retail sales of consumer goods rising just 0.4% in money terms. Both were published on 16 November.
Those numbers describe different things. The industrial measure removes price effects; the retail measure does not. Retail sales also cover a different range of activity from household consumption as a whole. Subtracting 0.4 from 4.8 would not reveal a stockpile of unsold goods, an output gap or a measure of excess capacity. The useful contrast is the pattern of activity, not that subtraction.
There is a more encouraging detail inside the retail report: sales excluding automobiles rose 2.5% year on year in October. The near-flat headline therefore conceals variation. It would be too sweeping to describe all Chinese consumer businesses as stagnant, just as the industrial total cannot establish that every factory is thriving.
Japan offers a different view of the same economic problem. The Cabinet Office’s first estimate for July–September shows real private consumption falling 0.3% from the previous quarter while private non-residential investment rose 1.6%. These are seasonally adjusted quarterly changes. Overall real GDP was essentially flat: the small decline rounds to −0.0% quarter on quarter, or −0.1% at an annualized rate. The annualized figure is not a year-on-year change.
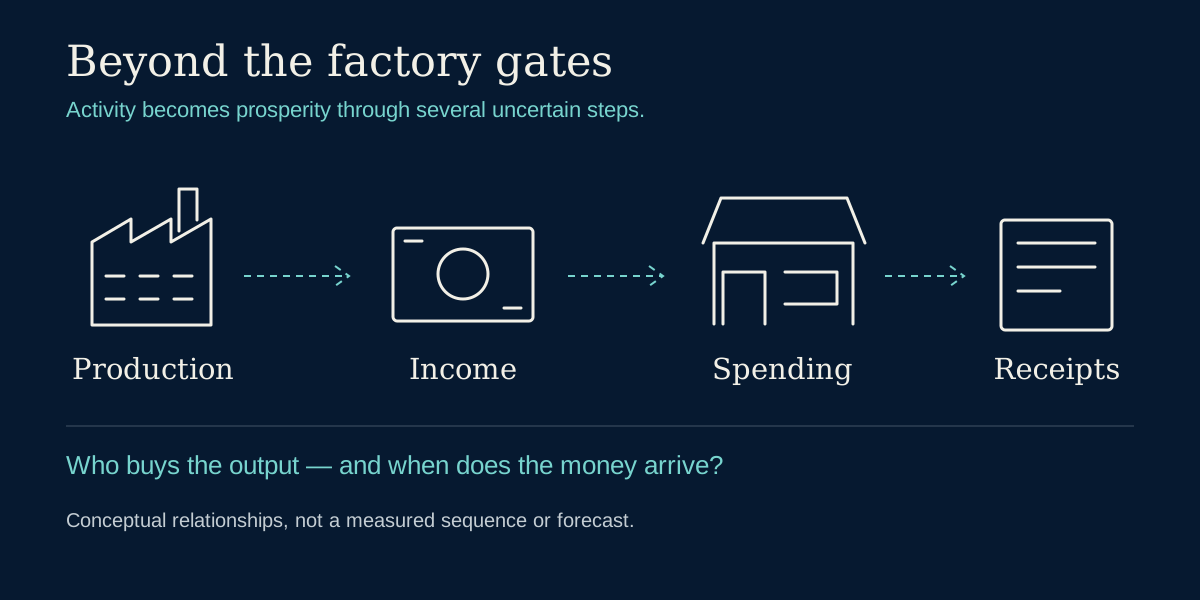
For a machinery supplier, stronger business investment can mean more orders now. For a retailer, what matters is whether customers have both the income and the confidence to spend. New equipment may eventually raise productivity and wages, but the payment for the machine and the improvement in household purchasing power can be separated by months or years.
That delay changes the business calculation. Consider a hypothetical manufacturer installing a new production line. If sales rise with capacity, the investment can spread fixed costs over more output. If customer demand disappoints, the firm still has equipment to finance and maintain. It may cut prices to attract buyers, accept lower margins or postpone its next project. These are possible responses, not findings that today’s statistics prove have occurred.
An export customer can provide another source of demand, and productivity improvements can make an investment worthwhile even without a consumer boom. Conversely, expanding equipment production does not guarantee that its eventual users will earn attractive returns. The destination of the output matters as much as the amount produced.
The consequences can travel beyond the factory. A firm that scales back a planned expansion may order fewer components and hire fewer contractors. Lower prices could help households, but weaker employment or wages could offset that benefit. A supplier serving well-funded investment projects might still grow while a nearby consumer business struggles. There is no single exposure to “the economy.”
The evidence remains provisional. Japan’s figures are a first estimate and will be revised as fuller information arrives. China’s releases are official aggregates with defined coverage, not a real-time account of every business. Neither set of data identifies one cause for cautious spending or proves that investment is excessive.
The next test is whether investment produces usable capacity, profitable sales and better purchasing power. Watch customer orders, utilization, real incomes and the breadth of spending over several releases. A busy factory is a promising beginning. The wider economic payoff depends on what happens beyond its gates.
Sources
- China NBS — October industrial production
October 2026; real year-on-year growth for industry above designated size.. Released 16 November 2026, 10:00 Beijing / 02:00 UTC / 03:00 CET, displayed release timestamp.. - China NBS — January–October retail sales release
October monthly observation and year-on-year nominal comparisons.. Released 16 November 2026, 10:00 Beijing / 02:00 UTC / 03:00 CET, displayed release timestamp.. - Japan Cabinet Office — Q3 2026 GDP, first preliminary estimate, table 1-1
July–September 2026; real, seasonally adjusted quarterly rates, with annualized GDP separately labelled.. Released 16 November 2026 date on PDF; precise publication hour not independently verified in this run..